Contents
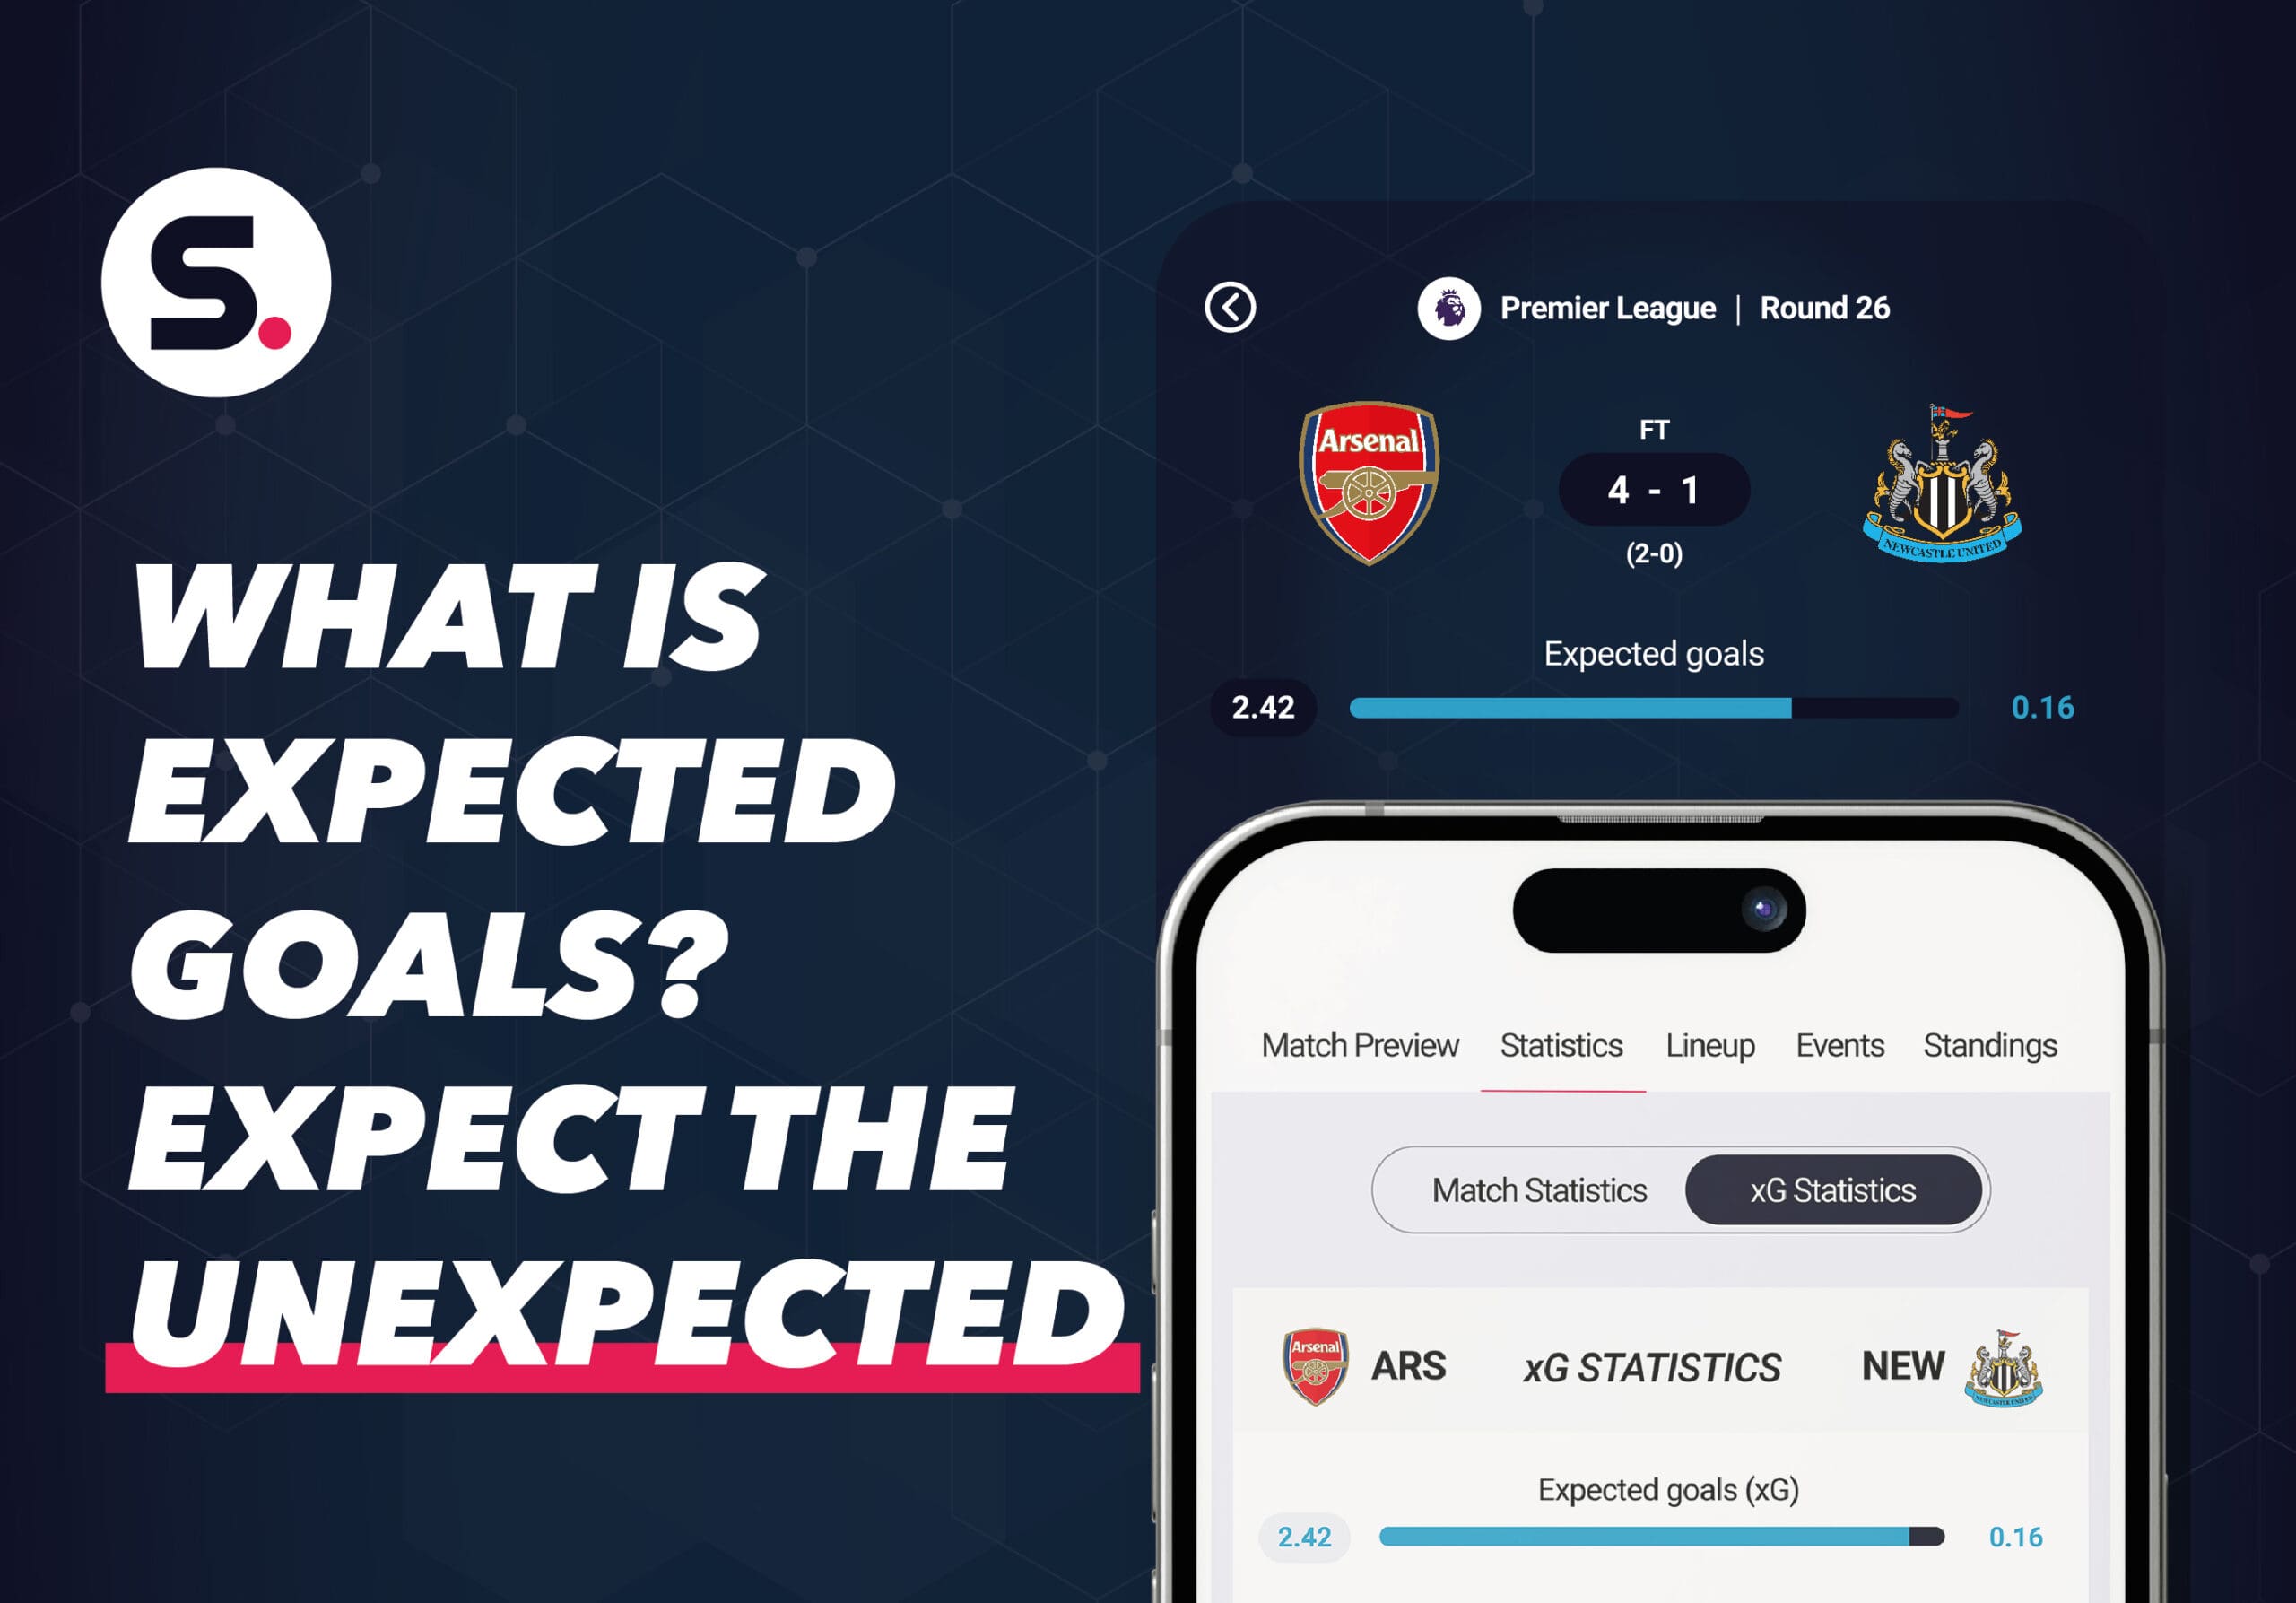
What is ‘expected goals’?
First, the abbreviation of Expected Goals is xG, so if you see xG, you will know we are talking about expected goals. So, what is the Expected Goals metric?
Well, most likely, you have used it before without even knowing. Maybe you didn’t calculate it correctly, but you have discussed whether a specific team’s win was deserved based on the chances, the strategies, and how the game progressed. You most likely did this based on your ‘gut feeling’ or other stats like possession or number of shots. However, xG works for you by calculating this based on different statistics and metrics.
*Note: Expected goals needs to be applied correctly. A common mistake at fixture level is that a team with a higher xG should have won the game. That is not necessarily true as xG only measures the chance quality and not the expected outcome of that particular fixture. We have another API for the predicted outcome, which is the Prediction API.
What do experts say
Let’s find out on a very reliable source: The Bundesliga.
“A xG model computes for each chance the probability to score based on what we know about it (event-based variables). The higher the xG – with 1 being the maximum, as all probabilities range between 0 and 1 – the higher the probability of scoring.
In practice, that means if a chance has 0.2xG, it should be scored 20 per cent of the time. If it has 0.99xG, it should be converted 99 per cent of the time and so on.”
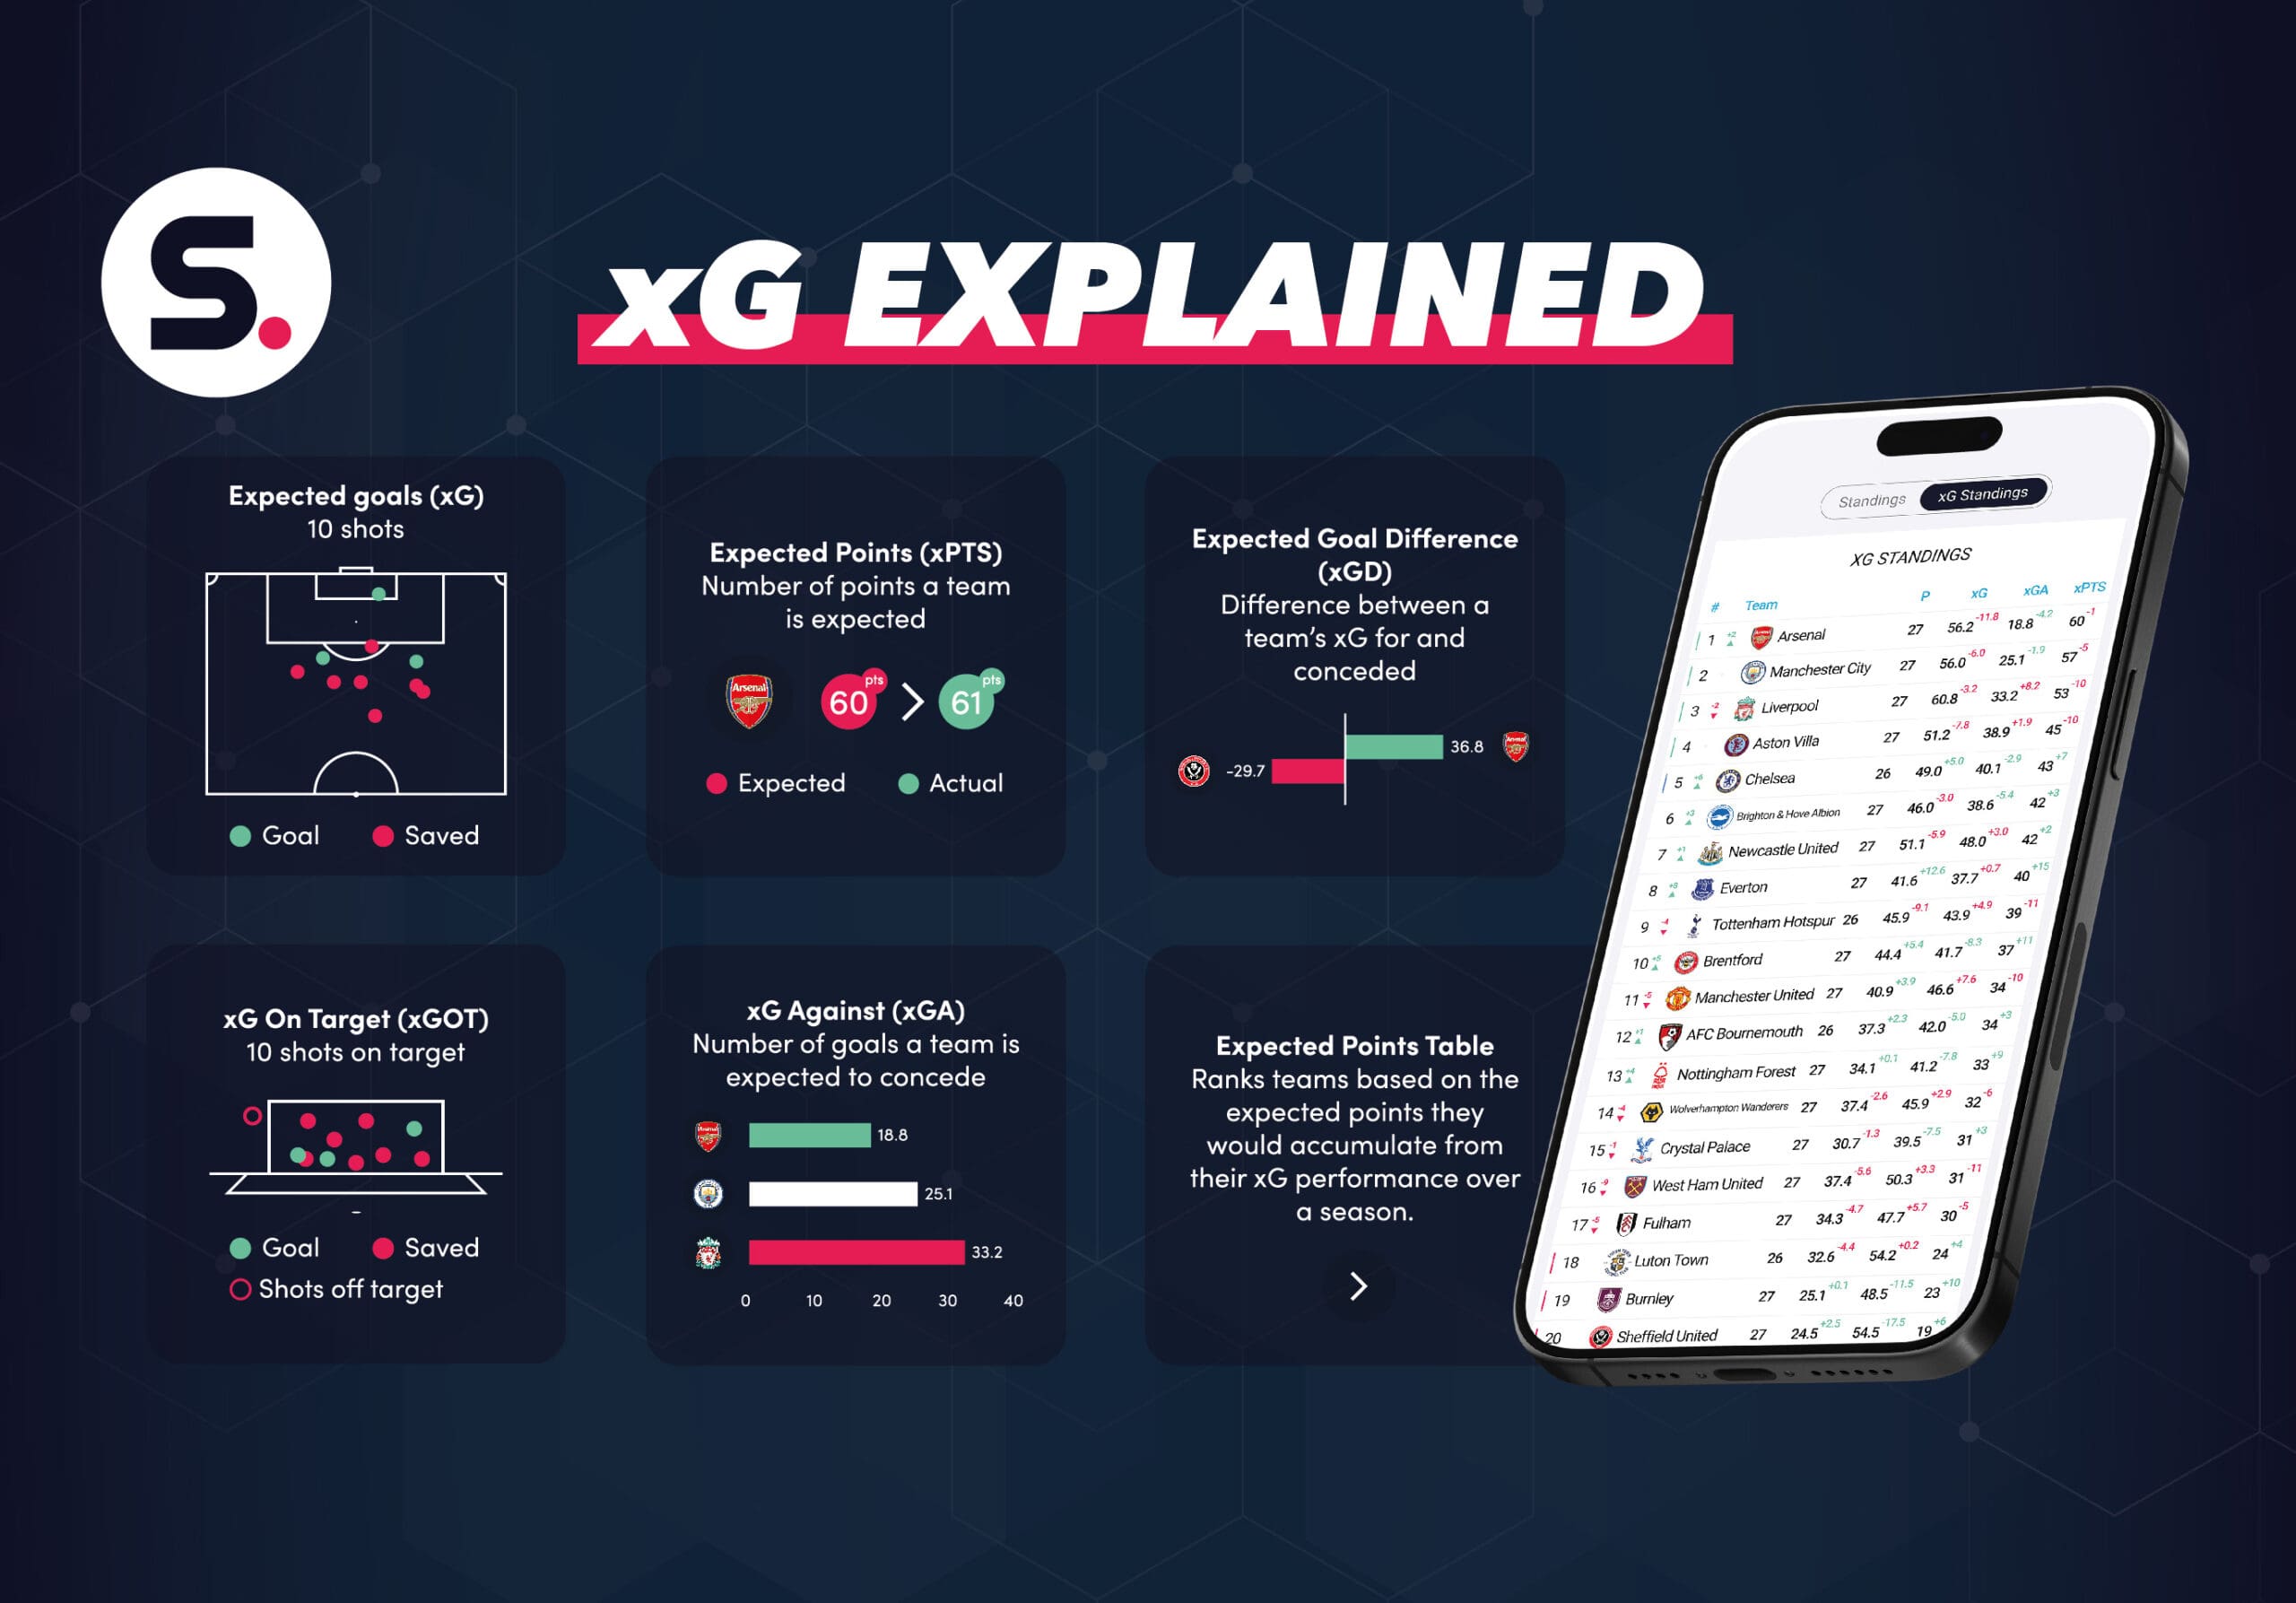
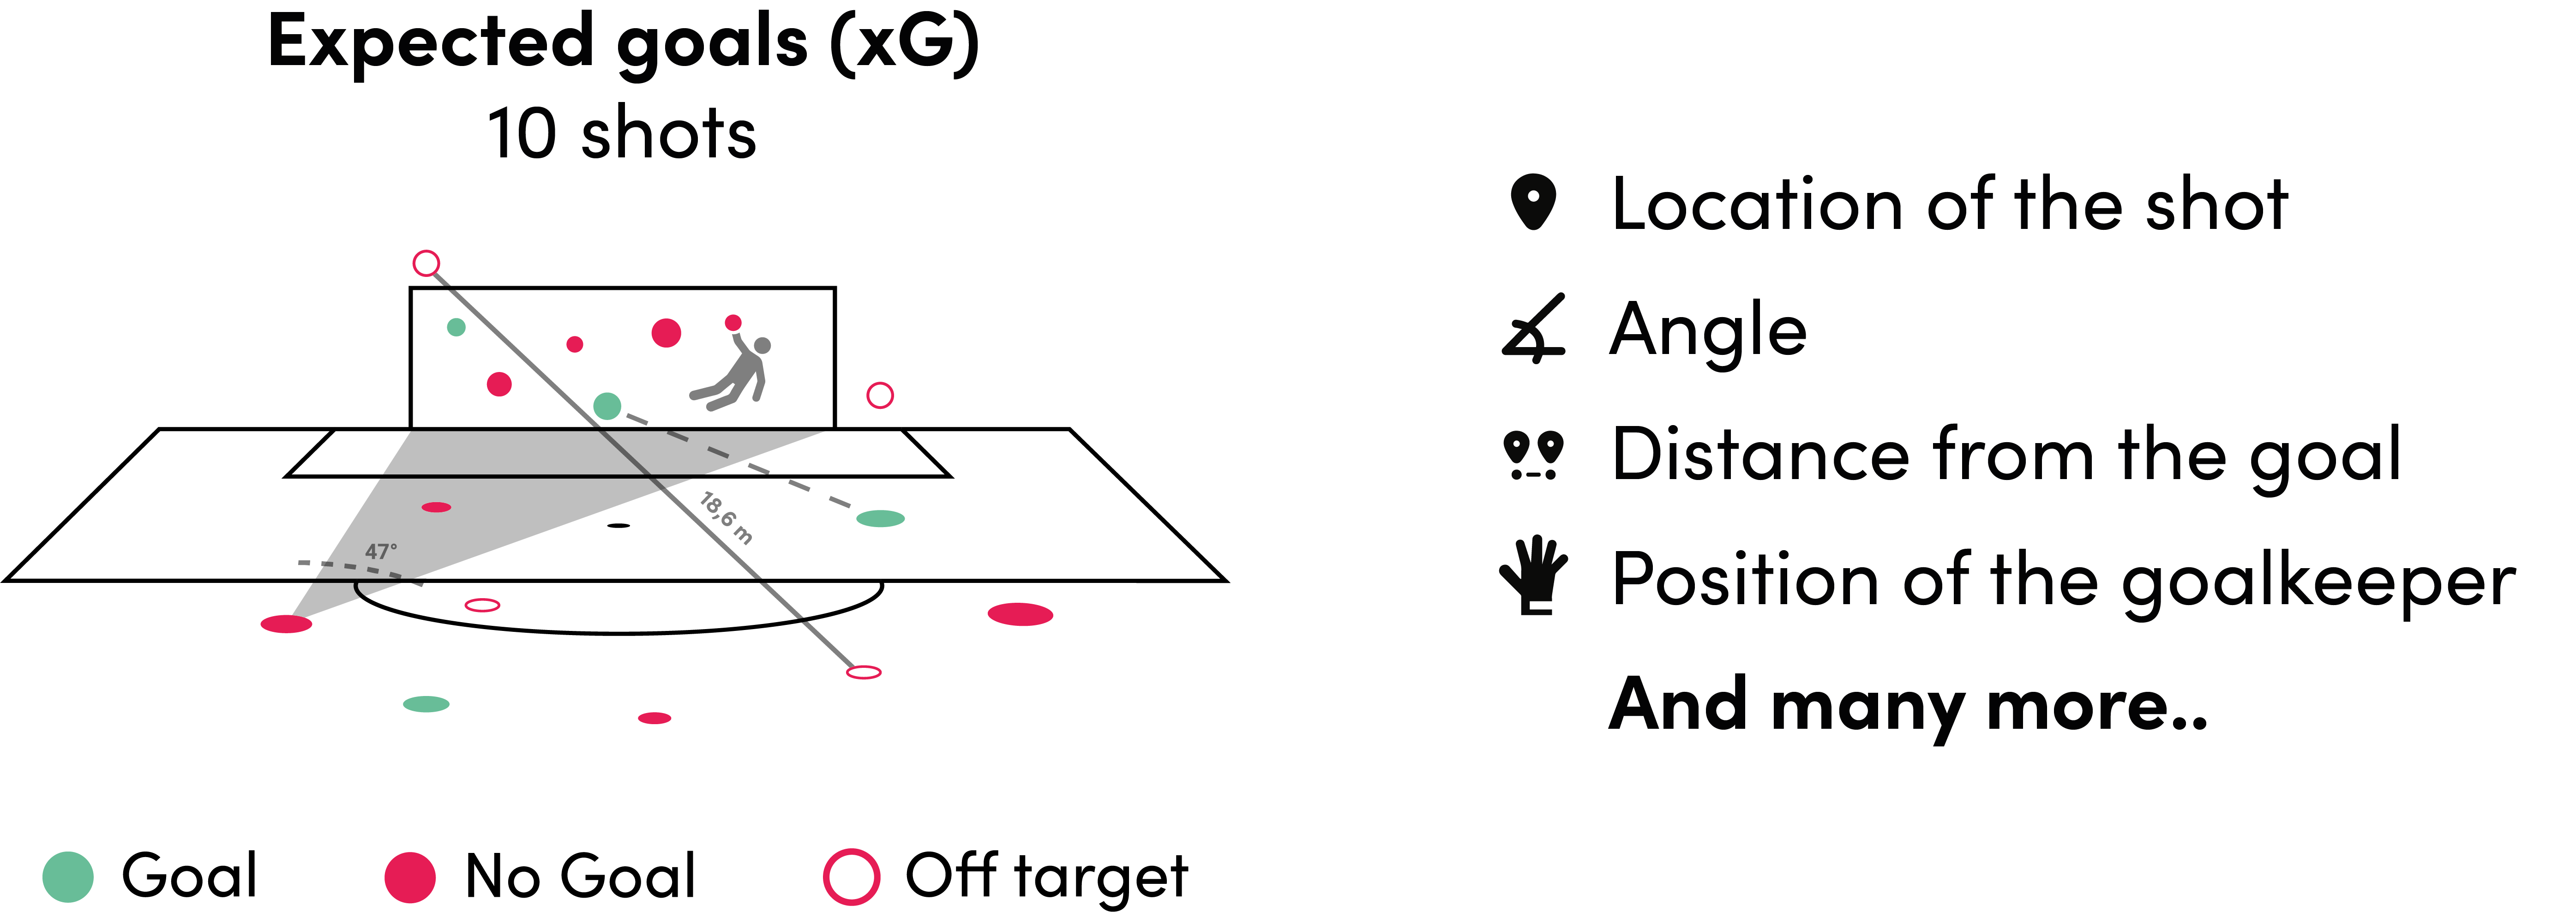
So let’s dive into that a bit deeper. Expected Goals (xG) in football is a statistical metric used to quantify the quality of goal-scoring chances created or conceded during a match. It measures the probability that a particular goal-scoring opportunity will result in a goal based on various factors such as the location of the shot, the angle, the distance from the goal, the type of pass that led to the chance, and other situational variables.
How is ‘expected goals’ calculated?
The calculation of expected goals is based on various factors such as the location of the shot, the angle, the distance from the goal, the type of pass that led to the chance, the number of defenders between the ball and the goal, the angle to the goal, the type of shot (header or foot), and the position of the goalkeeper, and other situational factors. Keep in mind that the quality of a player is not accounted for. So, for expected goals, it does not matter if Lionel Messi is the one taking a shot or if the data scientist of Sportmonks takes the shot. So, how do we do it? We have committed to writing an article about this on Medium.
Expected goals values
Expected goals is usually expressed as a value between 0 and 1, where 0 indicates a very low probability of scoring and 1 indicates a very high probability. For example, a clear one-on-one chance with the goalkeeper might have a high xG value close to 1, while a long-range speculative shot might have a low xG value closer to 0. Keep in mind that this counts for a single shot. In some situations, an xG value has a value higher than one. Think about when the total xG of a team is calculated. In this case, all shot-attempts a specific team has sent towards the goal will create a total xG for the team.
The expected goals metric for a team typically ranges between 0 and 2 or 3, representing the likelihood of scoring based on the quality of chances created or conceded. For a player, the range is even lower. Pay close attention to instances where the xG values seem unusually high or low. For example, an xG value higher than 5 might seem odd unless it’s Bayer Munich is playing Mainz ;).
So, now let’s dive in deeper based on the Bundesliga quote. In short, it measures the chance quality of a team’s shots. The probability rate is from 0-1. The probability ranges from 0 to 1. A chance with a value of 0 cannot be scored, whereas a chance with a value of 1 almost guarantees a goal. However, in football, there is no such thing as a 100% guaranteed goal. We have all seen videos of players missing in front of an open goal while only being one meter away from the goal line.
Knowing that an xG value above 0.38 is considered a big chance is important. For example, a penalty has an average xG of 0.79 to be scored. That is a high chance as there are no defenders between the ball and the goal, the ball is in the middle of the goal, so the angle isn’t too difficult, the distance is only 11 meters (12 yards), and the location of the keeper will most of the time be precisely in the middle of the goal.
Driblab shows how to apply xG to team and player analysis.
Is Expected goals Valuable?
This metric is valuable for teams, coaches, analysts, and fans as it provides insights into the quality of a team’s attacking play, defensive solidity, and overall performance. It helps assess whether a team’s performance aligns with the goals scored or conceded in a match and can be used for tactical analysis, player evaluation, and strategic decision-making. Find out why it is important below.
How to interpret expected goals
The metric is very valuable. However, it doesn’t show the complete truth of a match. For example, if team A scores in the first few minutes, they might hang back to play on the counter as they are 1-0 ahead. They do not need to pressure the opponent further, and they will save energy by letting the opponents decide the play as they need to score. The focus of Team A will be on defence and striking back on a counter, while Team B will try to score. As you can expect, the defending team will give away some shots. However, there is a good chance that there will be multiple defenders between the ball and the goal for most of those shots, as they are defending as a unit. The total xG of team B might be high as there are many shots, but the individual chances might be very low due to the defending tactics of team A.
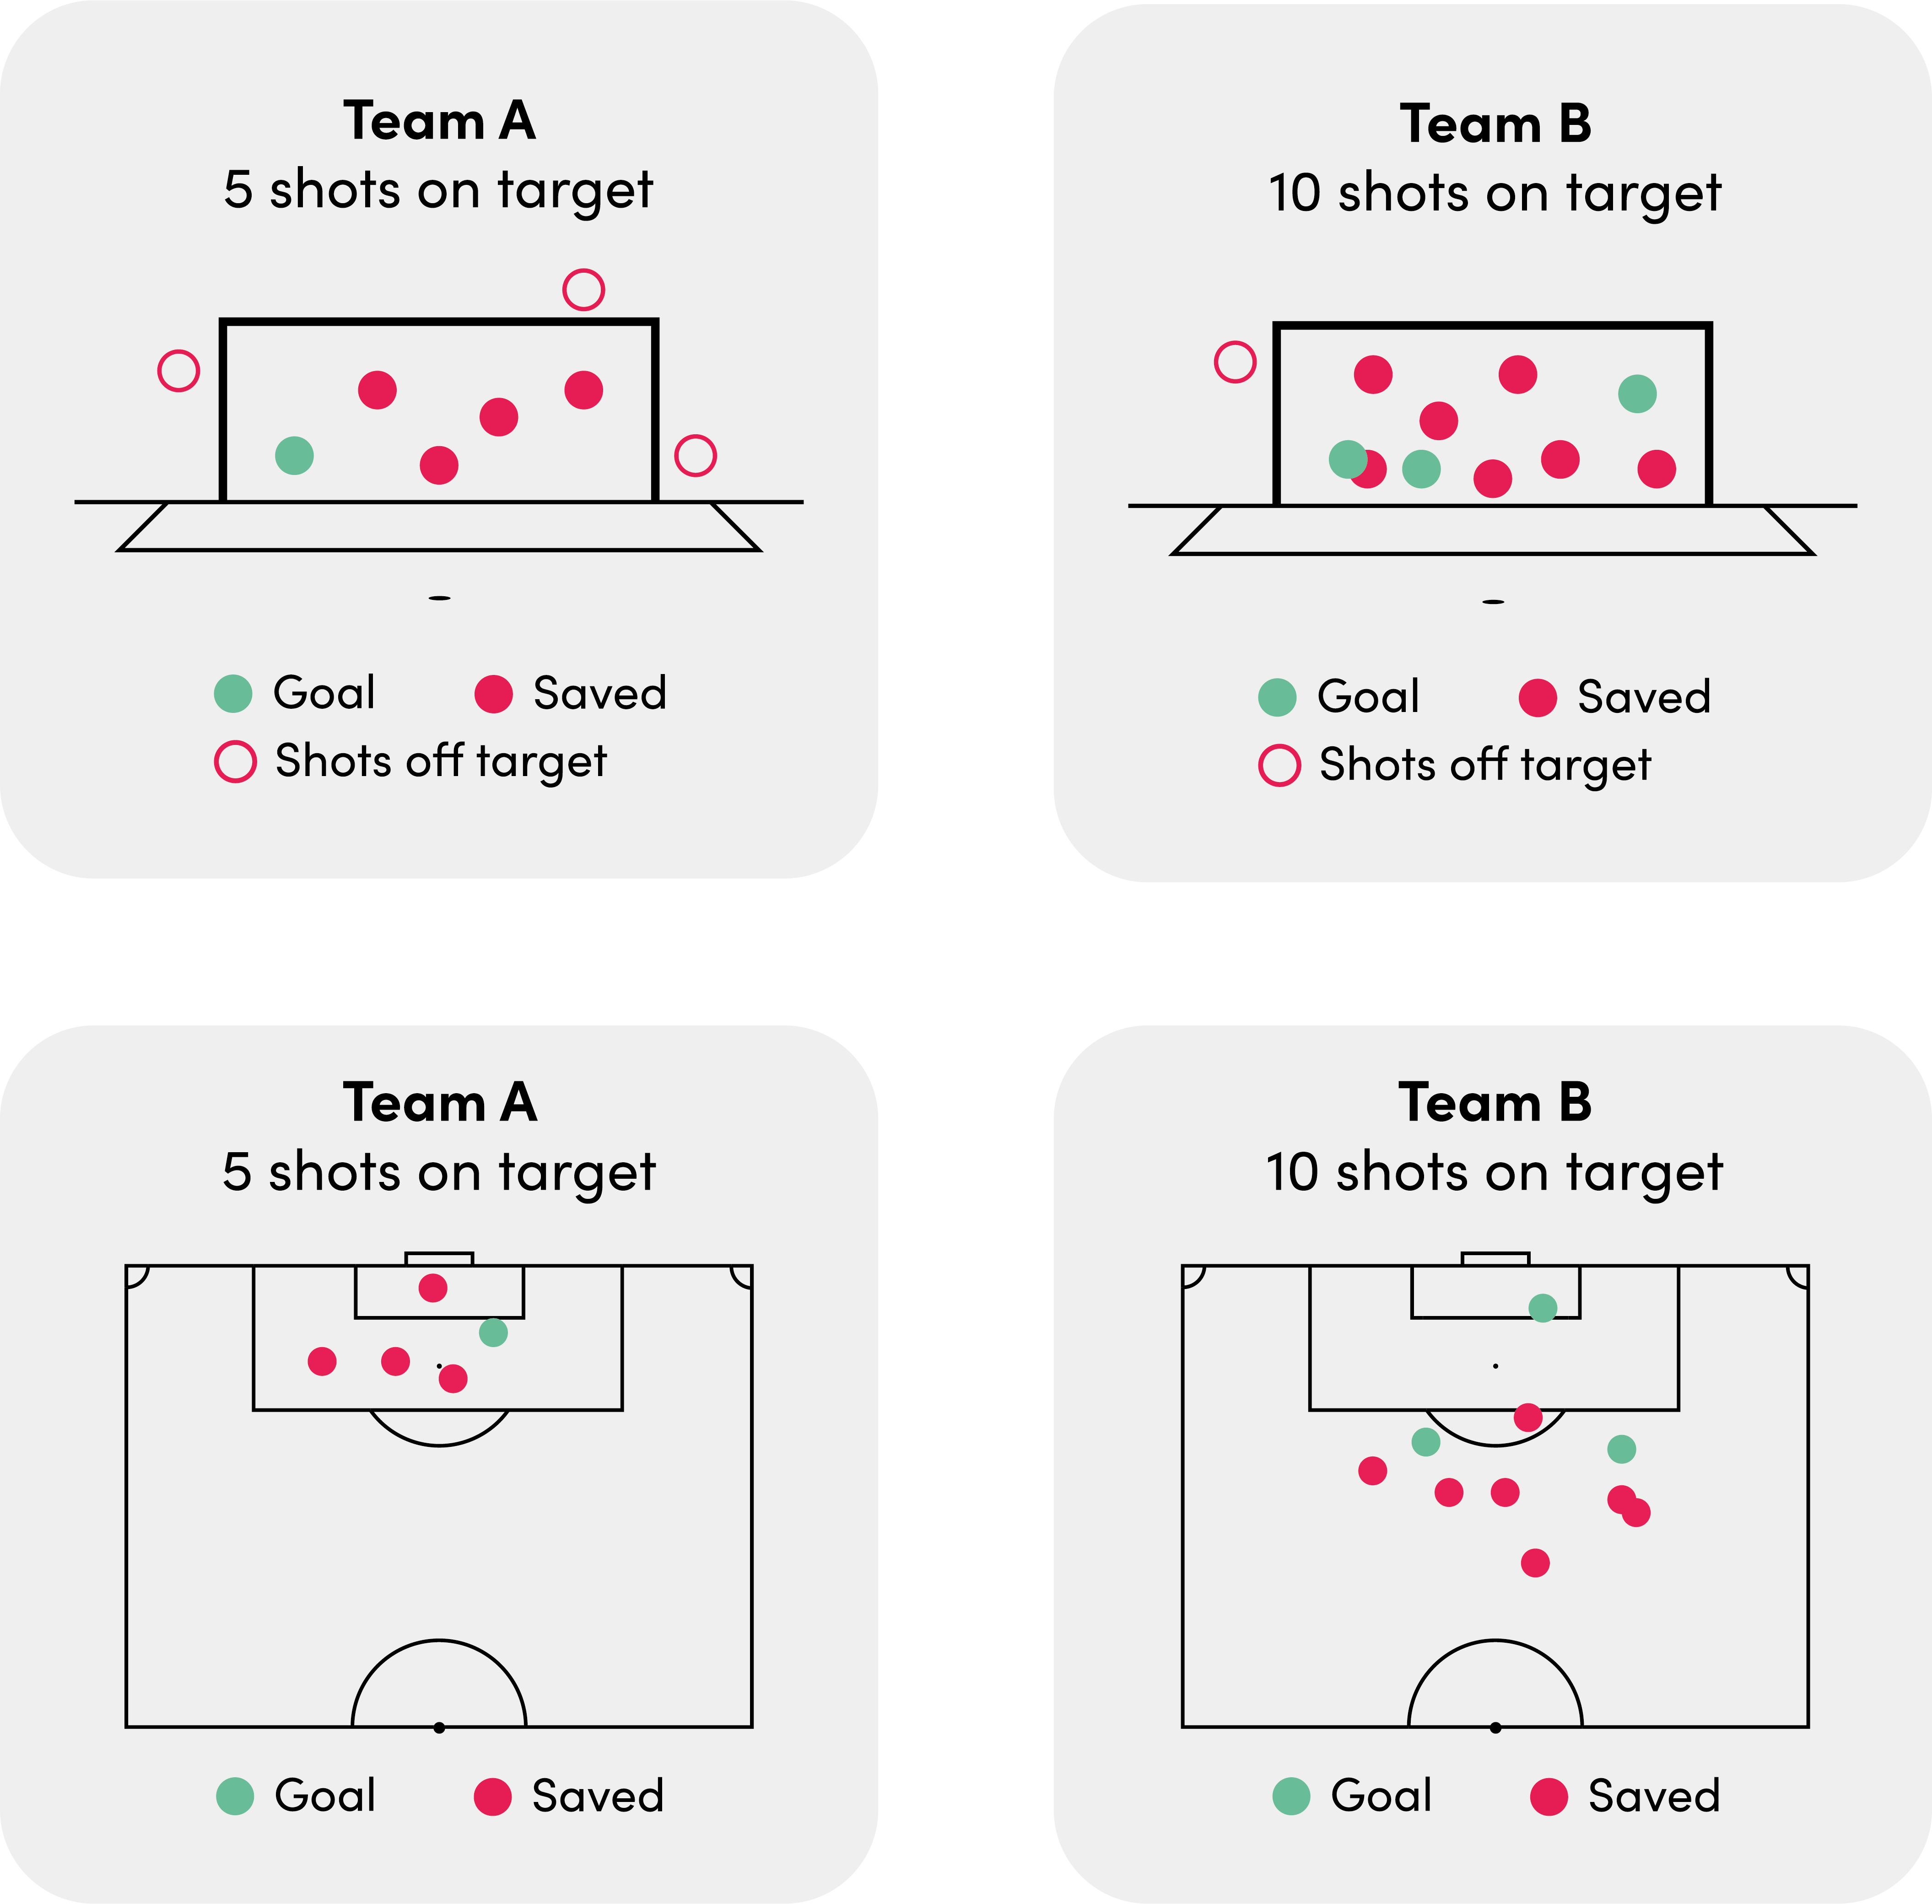
Another example is team A having five shots on target while team B has ten shots on target. You would argue that Team B had a better game. Well, if you look at the shot map, you will see the following:
You see, the shots from Team A were way closer to the goal than those from Team B. Who do you think was better now? This is why xG is a more effective way to determine who “deserved” the win than, for example, looking at possession or shots on target.
*Note: As mentioned earlier, deserving a win is not exactly what xG means. However, a lot of people interpret it like this.
Why is xG such a popular metric?
In mathematics, things tend to revert to their mean. xG is a good predictor of how a player will develop. It is great to see which teams and players are overperforming and underperforming. In a later blog, we will discuss xP (expected points) and over/underperforming in more. For now, we stay at the metric xG itself.
xG has its roots in the early 2000s and has evolved over time. Analysts and statisticians started experimenting with different metrics to measure the likelihood of a shot resulting in a goal based on various factors. In the mid-2000s, xG started to gain attention as a tool for analysing and understanding games in more detail.
In the early 2010s, xG became more mainstream, and several analytics platforms started including xG. For example, broadcasting stations, media outlets, and newspapers, among other websites and applications. More and more became xG part of the post-match commentary and discussions.
Today, xG has become essential for analysing and understanding Football matches, influencing coaching decisions, player evaluations, and fan discussions. Its journey from a niche concept to a widely recognised metric reflects the increasing sophistication and data-driven approach to understanding the beautiful game we know today.
Last but not least, xG is this popular because many other metrics can be calculated with the statistic. In our next xG blog we will dive deeper into the world of xG’s other calculations and metrics.
FAQ
Expected goals is usually expressed as a value between 0 and 1, where 0 indicates a very low probability of scoring and 1 indicates a very high probability. For example, a clear one-on-one chance with the goalkeeper might have a high xG value close to 1, while a long-range speculative shot might have a low xG value closer to 0. An xG value above 0.38 for a specific shot is considered a big chance. For example, a penalty has an average xG of 0.79 to be scored.
Keep in mind that the quality of a player is not accounted for. So, for expected goals, it does not matter if Lionel Messi is the one taking a shot or if the data scientist of Sportmonks takes the shot.